
Data, AI and Robotics

Data, AI and Robotics

laptop icon above galaxy texture

Online data analytics students prepare for top job in the country

By Srila Nayak

OSU Statistics online data analytics programs

Josh Stevens, an army veteran and a mid-career IT analyst at State Farm in Bloomington, Illinois, had been searching for the right online data analytics program for well over a year. The perfect match continued to be elusive. Either the curriculum fell short or the prerequisites weren't a fit and more often than not the tuition costs were steep. When he came across Oregon State University's new Master of Science Data Analytics program offered by the Department of Statistics, the price tag was immediately attractive to him.

At $28-$30,000, Steven found the program to be half the cost of data analytics programs at a lot of other universities. A data scientist who reviewed the curriculum assured Stevens that it would teach "the skills that are highly sought after in the field."

Close to finishing his first year in the program, Stevens couldn't be happier with his decision. Stevens considers the excellent teaching, the rigor of the courses and the lecture delivery mechanisms and technology to be the strongest attributes of the Data Analytics program.

"I am deeply appreciative of the amount of content that was taught and impressed by the powerfully effective teaching."

OSU Statistics is giving students like Stevens access to the training that will turn them into data scientists for companies, start-ups, governments agencies and research think tanks that are flooded with big data—a mind-boggling variety and volume of information about consumers, products and processes that has not been seen before.

One of the oldest statistics programs in the country, OSU Statistics recently took the big data plunge by launching two new online programs that teach students across the country how to turn massive troves of data into structured, practical and understandable information. The department has started an online Master of Science and a Graduate Certificate in Data Analytics programs, the first of their kind in Oregon.

The 45-credit two-year master's program and the 18-credit one-year graduate certificate will train professionals to make smart analytical decisions to understand massive data sets and answer crucial questions for businesses, companies and academic research.

Job surveys for the top 10 best jobs in the last three years have consistently ranked statistics-related careers very high on a list based on the criteria of income, growth outlook, stress and environmental factors. The message is unambiguous: talented statisticians and data geeks rule the market.

The 2017 jobs report released by career website CareerCast.com has even better news: Statistician tops the list as the No.1 job, and other quantitative and data-focused jobs follow close behind: Operations Research Analyst is No. 3 and Data Scientist is No. 5. Glassdoor's list of 50 best jobs in America has Data Scientist as the No. 1 job and Analytics Manager at No. 5.

The science and art of mining and distilling useful information from huge datasets has never been in greater demand, and the department is doing its share to meet the surging need for data analytics skills in this era of data explosion.

The Bureau of Labor Statistics projects demand for statisticians to grow 34 percent nationwide between 2014 and 2024. An eye-opening 2011 report from McKinsey Global Institute indicates there could be a shortage of 140,000-190,000 analytically skilled workers by 2018. A routine search reveals hundreds of openings for data science jobs in Oregon itself, ranging from iconic Portland-area companies such as Nike and Intel to fast-paced startups and a myriad of environmental, healthcare and consulting companies.

All trends indicate that data science is a sector in which demand outstrips supply, and if you possess a love for data and a talent for numbers, a bright future awaits.

The strengths of OSU data analytics

As educational openings proliferate in data analytics, OSU Statistics easily stands out among its peers in several important ways.

OSU statisticians are highly skilled at dealing with large qualities of complex and messy data and many have extensive experience mining data for insights across the fields of environmental science, agriculture, forestry and engineering. The courses in the new data analytics program are taught by award-winning and outstanding research faculty who have extensive hands-on experience and exposure to real big data challenges across academic and non-academic fields.

The online programs are offered through Oregon State Ecampus, which consistently ranks as one of the nation’s best providers of online education. In January 2017, OSU’s online programs were ranked in the top 10 for the third year in a row by U.S. News & World Report.

Statistics professors as well as faculty from the School of Electrical Engineering and Computer Science have created a rigorous, interdisciplinary curriculum that combines statistics, computer science, mathematics and plenty of real world data projects to give students deep and valuable experience with how to grapple with large amounts of variables and expose the underlying data structure. The objective is to impart a foundation in statistical reasoning, software and programming skills, and real-world experience that will make the graduates appealing to employers in a variety of industries.

Students are trained in advanced computational and statistical skills spanning the collection and storage of data to modelling, analysis, and the efficient communication of results to stakeholders. The online graduate program also offers an option in health analytics, where students can take elective courses in topics such as quantitative genomics—a specific track for people interested in pursuing public health or pharmaceutical research.

The M.S. program finishes up with a capstone project, a concrete example students can provide to an employer as evidence that they are ready to hit the ground running.

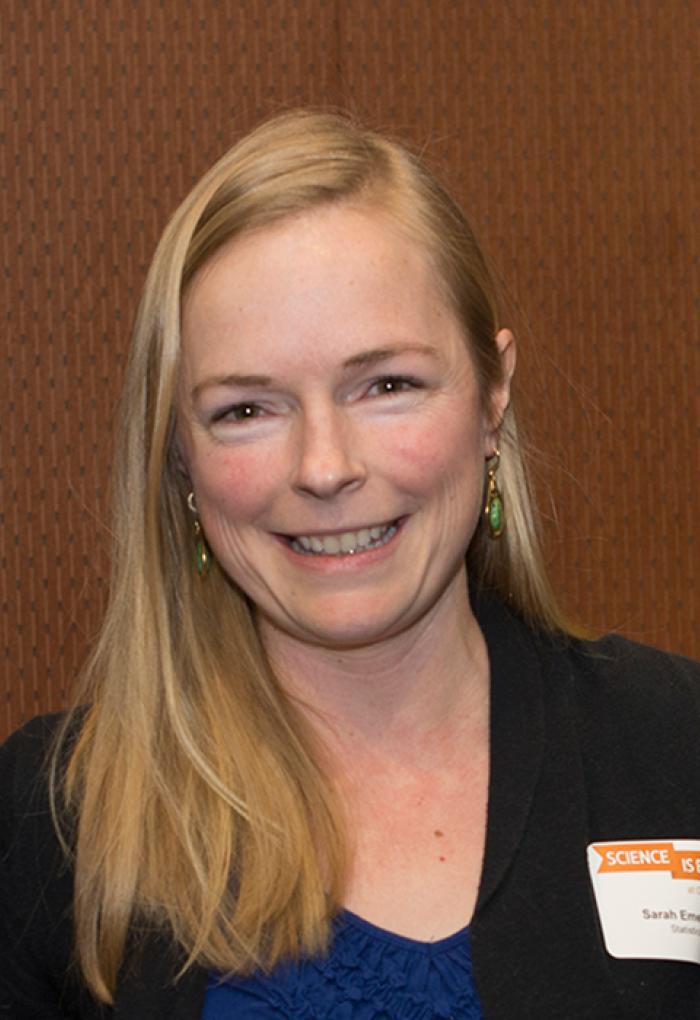
Stanford trained statistician Sarah Emerson has taught ST 517 (Data Analytics I) and is gearing up to teach ST 558 (Multivariate Analytics) in the Fall. An associate professor of statistics, Emerson believes the program's biggest strengths are its focus on the different quantitative tools and methods in data analytics as well as an edge it offers students in practical analytics training through its combined statistics and computer science curriculum. Computer science core courses cover topics in programming, big data management and applied machine learning.

"The most tangible skills are the three different programming languages that students will learn: R, SAS and Python," Emerson said.

These three are the most in-demand and popular programming languages in the business world. But Emerson is also keenly interested in encouraging certain habits of critical thinking in her class as students engage with pressing issues that have emerged with large datasets in the present day.

“One of my goals is that students in our courses can choose appropriate statistical analysis tools given a particular data set in the real world and understand what questions can be answered with a particular methodology,” said Emerson.

So far, Stevens has taken courses in the foundations of data analytics where he has learned the gamut of statistical modeling frameworks, predictive modeling, R, Python, survey methods and machine learning. Stevens, who holds a master's of science in technology management, entered the program without much of a statistical background. But after putting in 20-30 hours of work every week on his online data analytics coursework, Stevens is closing the gap. He has acquired statistical and analytical capabilities such as data visualization that are already paying off in his workplace.

"I didn’t know how to use R earlier. Now I am able to use R at my job for a variety of tasks—exploratory data analysis, visualizing large datasets—things that are impossible to capture in Excel,” said Stevens.

Stevens is also undaunted by the amount of work required as a student of data analytics. “It is not a program you can take lightly and set aside just two to three hours for every week. If it wasn’t challenging, I would question its value. It is pretty incredible what I have been able to learn in the last three quarters."

If you are fearless about the work involved, then the data analytics program may well be your cup of tea. They are well-suited to professionals looking to develop additional skills and learn specific tools in data analytics, as well as to an on-campus OSU students who wish to understand statistics and analytic practices for their research or future career prospects.

Teaching and learning data analytics in a virtual classroom

Assistant professor Charlotte Wickham, a Ph.D. in statistics from University of California, Berkeley, is a specialist in R training and has taught online courses in data visualization and the foundations of data analytics. She has taught diverse groups of online students, some of whom are enrolled in the online Masters statistics programs and others who hail from disciplines such as fisheries and wildlife and ecology.

Wickham has been pleasantly surprised by the discoveries she has made while teaching her first course in the program, chiefly among them being high levels of peer interaction and an enthusiastic and collaborative learning atmosphere.

“Students have been really forward with asking questions in the online discussions, and not having to respond on your feet means my responses are generally more complete," said Wickham.

The online data analytics lectures leveraged by the top-ranked OSU Ecampus are of a very high standard and quality. Lectures and slides are thoughtfully prepared using state-of-the-art and innovative course delivery strategies keeping in mind student retention and engagement. There is a lot of emphasis on "student engagement, student support and student satisfaction."

“Ecampus is fantastic in terms of the resources it provides. We are fortunate that Ecampus makes class engagement a big focus in online course preparation. They provide the technological support and the necessary pedagogical feedback to ensure there is a direct interactive perspective in our lectures to keep students involved, interested and attentive," observed Emerson.

Emerson found that the discussion boards were always abuzz with ideas, voices and statistical solutions.In addition to discussion boards, online quizzes and online labs create a rich, diversified learning environment, in which students learn and achieve more than they thought possible in an online program.

“It was a multi-faceted experience. My online students were required to contribute, but their contributions went well above and beyond the required level. It works out very well for the students because it turns out to be what they needed and what fit into their lives.”

Although online courses are completely prepared and all lectures pre-recorded well before students actually go through the class, at OSU it continues to be an interactive process between students and teachers through Skype chats, emails and discussion boards.

“I expect instructor involvement is not unique to OSU. But I know that is not the way some online courses are taught. We want to keep our students interact with each other, interact with the instructor and learn from the interaction process," added Emerson.

This combination of inspiring and high-quality teaching as well as exposure to statistical and computational tools to analyze data are helping professionals succeed as data scientists. Stevens is rapidly gaining skills in advanced analytics that are helping him excel at his present job and multiplying his professional options.

"The Masters of Science program is enhancing my career prospects in several ways,” said Stevens. “It makes me more effective at work and more well-rounded in my work as an IT analyst. It also allows me more options should I decide to change careers.”

The advance of big data shows no signs of slowing and OSU's online data analytics program are training a new generation of data scientists with the rare and highly marketable combination of statistical and computational skills and scientific thinking.

earth from space

Bridging computer science and statistics to optimize results from "Big Data"

The Spring 2017 Milne Lecture on big data

The spring 2017 Milne Lecture features Michael I. Jordan, the Pehong Chen Distinguished Professor in the Department of Electrical Engineering and Computer Science and the Department of Statistics at the University of California, Berkeley. He will discuss “On Computational Thinking, Inferential Thinking and Data Science."

Professor Michael I. Jordan in front of grey backdrop

Professor Michael I. Jordan

Hosted by the Department of Statistics, the spring Milne Lecture will be held on Tuesday, May 16 at 4 pm in the Learning and Innovation Center, Room 128. The Milne Lecture in Mathematics, Statistics and Computer Science is a collaborative series of distinguished lectures launched in 1981 to honor founding Mathematics Department Chair and William Edmond Milne, a pioneer in numerical analysis.

In his lecture, Jordan will discuss how the rapid growth in the size and scope of datasets in science and technology has created a need for novel foundational perspectives on data analysis that blend the inferential and computational sciences. That classical perspectives from these fields are not adequate to address emerging problems in "Big Data" is apparent from their sharply divergent nature at an elementary level. In computer science, for example, the growth of the number of data points is a source of "complexity" that must be tamed via algorithms or hardware, whereas in statistics the growth of the number of data points is a source of "simplicity" in that inferences are generally stronger and asymptotic results can be invoked.

On a formal level, the gap is made evident by the lack of a role for computational concepts such as "runtime" in core statistical theory and the lack of a role for statistical concepts such as "risk" in core computational theory. Jordan will present several research vignettes aimed at bridging computation and statistics, including the problem of inference under privacy and communication constraints, and methods for trading off the speed and accuracy of inference.

Michael I. Jordan is the Pehong Chen Distinguished Professor in the Department of Electrical Engineering and Computer Science and the Department of Statistics at the University of California, Berkeley. He received his Masters in Mathematics from Arizona State University, and earned his Ph.D. in Cognitive Science in 1985 from the University of California, San Diego. He was a professor at Massachusetts Institute of Technology from 1988 to 1998. His research interests bridge the computational, statistical, cognitive and biological sciences, and have focused in recent years on Bayesian nonparametric analysis, probabilistic graphical models, spectral methods, kernel machines and applications to problems in distributed computing systems, natural language processing, signal processing and statistical genetics.

Professor Jordan is a member of the National Academy of Sciences, a member of the National Academy of Engineering and a member of the American Academy of Arts and Sciences. He is a Fellow of the American Association for the Advancement of Science. He has been named a Neyman Lecturer and a Medallion Lecturer by the Institute of Mathematical Statistics. He received the International Joint Conference on Artificial Intelligence Research Excellence Award in 2016, the David E. Rumelhart Prize in 2015 and the Association for Computer Machinery (ACM)/Association for the Advancement of Artificial Intelligence (AAAI) Allen Newell Award in 2009. He is a Fellow of the AAAI, ACM, American Statistical Association, Cognitive Science Society, Institute for Electrical and Electronics Engineers, Institute of Mathematics and Statistics, International Society for Bayesian Analysis and Society for Industrial and Applied Mathematics.

Support for the Milne Lectures comes from a generous gift from the Milne family as well as support from the College of Science’s Departments of Mathematics and Statistics, the College of Engineering‘s School of Electrical Engineering and Computer Science and from the Center for Genome Research and Biocomputing at OSU.

Juan Restrepo in his classroom

Former musician, aspiring surfer, mathematician: Juan Restrepo, a life of diversity

By Katharine de Baun

Juan M. Restrepo, Mathematician

Some of the most interesting lives don’t move forward in a straight line. Mathematician Juan M. Restrepo thought he would spend his life as a professional musician, for example, until he stepped into an advanced math class and never looked back. Recently, he shared reflections on his life and work, including why a diverse, interdisciplinary approach is critical to his research.

You recently won the SIAM (Society of Industrial and Applied Math) Geosciences Career Prize for your outstanding contributions to the field of computational geoscience. Can you explain what computational geoscience is?

There are three ways to do science: theoretically, experimentally (this includes observation/field work) and computationally. Most scientific results now combine all three modalities. The award I received acknowledges the impact I’ve had in applied mathematics, specifically in developing new computational tools that make it feasible to pursue geoscience problems that were not amenable to existing computational tools. These tools allow us to tackle new and challenging questions in the field.

What are some of those new and challenging questions?

How to model and make predictions about massively complex systems like Earth’s climate or financial markets. Typically, in these systems, knowing something about each element in isolation is extremely helpful but doesn’t automatically lead to an understanding of the system as a whole. Complex systems have many degrees of freedom (as well as variables that cannot be precisely pinned down). So we are seeking ways to eke out a low dimensional representation of the system that either explains the basic mechanism behind the complex behavior, and/or enables us to capture the complexity with a smaller (usually finite-dimensional) number of degrees of freedom--all the while taking into account the consequences of uncertainties in the physics and its parameters.

I have also proposed new quantitative tools and techniques for improved forecasting, particularly in highly unstable systems like the weather and extreme or rare events like droughts and deluges. I have worked on statistical representations of high dimensional systems that then yield more manageable proxies of the full system. I have worked on tools that try to help us look into the near future and answer questions like “How warm is it getting?” or “What are the trends in today’s financial data?”

What makes this work so difficult?

For one, we don’t have a full understanding of a lot of things in isolation, let alone as interacting elements in larger systems. The types of problems I focus on have lots of small things that interact with each other and these, in turn, interact as groups in different ways.

To illustrate, I’ll use a problem that my student Dallas Foster, my collaborator Matthew Sottile and I are working on. The problem relates to how a collective group of ants react to certain environmental conditions. In a colony of tens of thousands of ants, the behavior of each ant requires a huge number of degrees of freedom to describe. One might think that understanding everything about each individual ant and understanding how each individual ant interacts would lead to answers on how a large collection of ants respond to their environment (never mind the fact that each individual ant would demand a whole library-worth of information). The traditional thing to do is to formulate a model for the large-scale behavior and forgo the small scale. But it turns out that there is only a very tiny number of problems for which one can generate a model of the group while ignoring small-scale interactions or individual agents. The collective ant case is representative of a myriad of problems where small scales cannot be ignored.

But it turns out that there is only a very tiny number of problems for which one can generate a model of the group while ignoring small-scale interactions or individual agents. The collective ant case is representative of a myriad of problems where small scales cannot be ignored.

In response to this type of problem, we are working on formulating a population model with a manageable number of degrees of freedom that reasonably describes the collective behavior, but does not ignore critical aspects of small-scale interactions of the ants or individual ants. The ‘dimension reduction’ we want to effect does not ignore critical small-scale interactions. Instead, the small-scale interactions are ‘upscaled’ so that they affect the collective, without requiring specific knowledge of the small scale. We will need to create a special type of statistics that allows us to ‘filter’ the small scale to get the collective effect of small-scale interactions at the larger scales of the group behavior.

You are so interdisciplinary – with multiple appointments across colleges in the Departments of Statistics, Electrical Engineering, Computer Science and Physical Oceanography. Is an interdisciplinary approach necessary to the questions you study?

A salient characteristic of my research output is that I tightly combine physics, mathematics, computation and data in the tools I develop. Hence, for me interdisciplinary exploration is necessary. A word of caution is in order, however. Although academia now considers interdisciplinary research a good thing, in practice, this modality of investigation is not suited for everyone. It can be career suicide for some, in fact.

Why? What are the dangers?

If you don’t achieve expertise in any particular subject, it can lead to not getting tenure, not getting grants, and not being perceived as “scholarly” enough. In academia, you are rewarded for developing mastery and this should be unique: this is what we call expertise. And without expertise, you risk not being consequential. Most commonly, without enough depth in a core discipline, you risk discovering something that's already known, or, worse yet, rediscovering something and doing a worse job at it.

So I advise my students to be aware of what their strengths are, what they’d like to work on, and then think strategically about how to get there. Some are more comfortable being specialists, and that’s fine. Applied mathematics, applied statistics and applied computer science are good homes for people with diverse interests, as they grapple with a variety of archetypical computational problems which are common to many engineering and science applications.

Interdisciplinary work makes perfect sense to me. But being interdisciplinary should not be considered synonymous with being diverse. The desire has never been stronger than it is today to tackle problems that cross disciplines and so there is a demand for people who have the ability and background to work across disciplines. But diversity in science has always been critical: we need diverse but expert ways to tackle problems, diverse but state-of-the-art techniques, etc. Diversity means working across disciplines, but it also means tackling problems with different specialized tools.

How did you personally arrive at having so many disciplinary strengths?

How I arrived at having so many interests is a colorful story. Believe it or not, I used to be a professional musician. Tired of the long hours, bad conditions and low pay, I went back to school to take a break from work. Having concentrated on music and philosophy as an undergraduate, I thought it would be fun to do something completely different and chose engineering. I had nothing to lose since this was just a break and I planned to return to music anyway. My first mathematics class, in partial differential equations, was a turning point.

What happened? Did the professor recognize you in some way?

The professor was Michael Tabor at Columbia University. He often says I was his “best music student.” [Laughs] I wasn’t all that bad; I got an A-. Professor Tabor, who oddly enough later became my boss when I was faculty at the University of Arizona, strongly suggested I consider a career in applied math. He also loves music and I spent a fair bit of time in his office discussing science and music. My intention was to return to music after my foray in engineering, but I did not return to music. From engineering I eventually switched to physics and mathematics. I had more questions of the “how” and “why” variety than of the “what for.”

That’s quite a switch. As a physics major, how did you then become interested in computational geoscience as a field?

Geosciences appealed to me because in many of its challenging problems one is faced with the interplay of diverse physics across vast scales of space and time. A love of the outdoors probably plays a factor, too—I spend a lot of time in adventure traveling, skiing, climbing, trekking and biking.

Your work has focused substantially on oceans.

I love the ocean and was completely smitten by the idea that there were scientists who could understand some aspects of what makes the ocean so amazing, and were bold enough to think that someday we could understand the oceans as a whole.

Specifically, I’m fascinated with the role played by oceans on the transport of heat around the globe, and the destabilizing role played by perturbations of the thermally- and salt-driven circulation we presently enjoy. I’m also interested in the role ocean transport plays in the movement of greenhouse gases and the maintenance of ice snow caps and their reflectance of the Sun’s radiation.

I am also fascinated by waves. The focus of my Ph.D. research was in a rather special wave called a soliton. It has wonderful/rich underlying mathematical structure. Incidentally, there are folks here at Oregon State who are world experts in solitary waves, the family of waves in which solitons belongs. I’m also exploring the role that waves play in Earth’s climate and the interaction between ocean waves and currents. I’ve developed models for how specific types of sandbars form and used supercomputers to characterize the fundamental forces on sand particles as they are forced by shearing and wavy ocean flows.

Presently I am developing a model for ocean oil spills.

young Juan Restrepo standing on beach with surfboard

Restrepo in his surfing days

Speaking of waves, you used to be a surfer. Does that experience have anything to do with your interests now as a scientist?

When I was a postdoc in Chicago I crewed for several sailing teams. When I was at UCLA I decided to learn to surf. The first board I borrowed came back decorated with duct tape. I was terrible, but usually the first in, the last one out. The good surfers tolerated me, perhaps because they thought I made for good shark food.

But I was a good source of information: I tracked swells, tides and wind, and predicted the best time to get to the beach; I had a good idea of when waves were worth riding and understood how wind affected waves. Several of my nearshore scientific studies were inspired by these experiences: for example, my interest in how waves transport sand, pollutants and swimmers. One of my recent results explains why flotsam and jetsam parks itself outside of the break zone, a finding relevant to tracking pollution in the nearshore, also known as "sticky waters."

You are a strong advocate for diversity in science. Where does that passion/commitment come from?

Innovation is the most significant competitive, technological, cultural and economic asset this country has had. It may be argued that it is in peril presently.

Science thrives on innovation, and innovation is strongly correlated with diversity. Diversity is essential in collective adaptation, and thus essential to evolutionary biology. For similar reasons, it is also essential to science.

There are more practical reasons for encouraging diversity: for example, with regard to gender, it is patently stupid to ignore 50 percent of the potential workforce. Diversity leads to collective work adaptation. It also leads to a culture of learning and of listening.

Diversity makes organic sense to me: my background and my life history is a story of diversity. I grew up in a multi-ethnic neighborhood in big cities, in a family of artists who hailed from three continents. Diversity is essential to my work: I tend to work with people who contribute specialized skills and appreciate my creativity and ability to draw ideas from diverse disciplines.

What are your hopes for the future of computational geosciences as a method/field/set of inquiries and what are you working on now?

I am working with a team of statisticians, engineers, and social scientists to formulate adaptive response strategies to disasters. As usual, I am taking a "diverse" approach: in addition to instrumental data, we want to incorporate citizen cell phone reports to produce quantitative data that allows us to tell what's happening as the disaster is taking place in real time.

We need anthropologists to exploit social media and to interpret citizen data. We are using ideas of statistical physics to formulate cluster dynamics of populations responding to disasters. We are combining statistically physical models and data to develop fast algorithms that allow us to forecast and test options for future responses based on past disasters.

OSU is a perfect research environment for this project: it is supportive of diversity, and it builds upon many of our research strengths. It’s also locally relevant, given that we live in the Cascadia Zone, and globally significant because what we learn here will impact on disaster response elsewhere.

Data Visualization Exhibit in hallway

Data visualization exhibit spans six centuries

By Srila Nayak

Does the term “data visualization” sound like a dyed-in-the-wool twenty-first century phenomenon? If the phrase only conjures images of computer generated infographics, that constitutes just a snapshot of the long history and tradition of data visualization.

Diagram of pie charts

Image credit: Gannett, Henry. Statistical Atlas of the United States: Based on Results of the Eleventh Census. Mis. Doc. (United States. Congress. House), 1898.

Data visualization which is a way of making information easier to understand through visual presentation and arrangement has its origins in diagrams of celestial bodies, maps and thematic representations of the known world, some of which date to the 7th millennium BC.

These pictorial presentations combine art, science and statistics to map everything from time, distance and space to geology, economics, demography and health data.

A new exhibit at Oregon State University, Beautiful Science, Useful Art, explores the evolution of graphics through six centuries as new forms of data visualization developed in response to technological innovations (color, lithography, printing press and computers), social conditions, cultural values and advances in visual thinking and cognition.

The exhibit is co-curated by Anne Bahde, rare books and history of science librarian, and Charlotte Wickham, assistant professor of statistics. It is open to the public until August 2017 in the Special Collections and Archives Research Center (SCARC), 5th floor of the Valley Library.

The exhibit showcases how the practice of visualizing data has inspired new insights in numerous fields and encouraged collaboration across disciplinary boundaries. Using examples of visualization from 1500-2016, the curators have grouped the great variety of data visualization into four different categories: integrity, beauty, utility, and novelty.

Bahde and Wickham have been working on the exhibit since July 2016. They combed through hundreds of archival collections and rare books held in SCARC to come up with illustrative examples that tell a very full and rich story of how data visualization has progressed to become a powerful and pervasive element of communication and knowledge in the present day.

“We are trying to show a diversity of visualization types and have taken examples from the papers of renowned scientists, artists, and researchers. The exhibit carries historical specimens with data from the sciences, social sciences, history, art, economics, natural resources, agriculture and more,” said Bahde.

Several events will take place around the exhibit. On Wednesday, May 3, a lecture panel will bring together three experts from different disciplines to examine the impact of data visualization on their work, and to explore the interdisciplinary connections that bring new insight to the study and production of visualized data. The speakers are:

Ehren Pflugfelder, “Elusive Elegance in Data Displays.” Assistant professor of rhetoric in the School of Writing, Literature and Film.

Ben Dalziel, “Data as Wilderness.” Assistant professor in the departments of integrative biology and mathematics.

Daniel Rosenberg, “Against Infographics.” Professor of History at the University of Oregon, co-author of Cartographies of Time: A History of the Timeline.

The lecture will begin at 5:00 pm in SCARC, 5th floor Valley Library. The exhibit is a part of SPARK: A Year of Arts + Science, a yearlong celebration of the intersection of the arts and science.

snowy mountains

Quantifying risk in a changing world

By Katharine de Baun

Landscapes at danger due to climate change

Note: this article is part of a series on how Oregon State scientists are working to mitigate climate change. Read more: Warm Oceans need Cool Science (introduction), Informing Policy and Sustaining Resources.

In 2016, our planet reached the highest temperature on record for the third year in a row according to independent analyses by NASA and the National Oceanic and Atmospheric Administration. Analyzing big data to model our evolving future is mission critical in an era of potentially catastrophic global warming.

“Statistical analysis and data science are key to discoveries and innovation,” says Sastry G. Pantula, dean of the College of Science. New fields involved in big data like bioinformatics are often interdisciplinary and collaborative.

“Solving major complex issues …requires teams with a diversity of expertise across science, mathematics and statistics. An interdisciplinary cohort enhances depth in core areas, breadth of communication across various fields, and strength in statistical and computational skills,” adds Pantula. Scientists at Oregon State work with big data to tackle climate change on many fronts.

Big data for the next generation

Mathematician Juan M. Restrepo is Chair of the Focus Group on Climate in the American Physical Society. He works on improving weather and climate forecasts by combining data and weather models, and is presently focused on finding ways to compute statistics of rare and extreme weather events. Some of the methods developed in this line of research lead to adaptive ways to respond to disasters, such as flooding and hurricanes.

Juan Restrepo in front of brick wall

Juan M. Restrepo, mathematician

Restrepo and statistician Alix Gitelman are co-principal investigators in a $3 million NSF Research Traineeship to prepare a new generation of scientists capable of assessing and communicating risk and uncertainty in the development of marine resource management strategies and policies. The student teams comprise future scientists, engineers and social scientists, who are trained to work with big data, engineered and natural systems, and stake-holders. Restrepo, together with students, statistician Claudio Fuentes and engineer Harry Yeh, is developing improved methods for forecasting and responding to tsunami disasters.

Models for real-world problems and solutions

Mathematician Malgo Peszynska and her students collaborate with geophysicists, engineers, microbiologists and others to create mathematical models that are accurate, fast and relevant to better understand a warming climate. The models predict how warming temperatures can trigger the release of huge pockets of methane gas trapped in ocean sediments, and how leakage could occur if carbon dioxide emissions are pumped into the ground.

Malgo Peszynska in front of shrubbery

Malgo Peszynska, mathematician

Mathematician and biologist Patrick De Leenheer is at the leading edge of mathematical biology, a new branch of study that has evolved in recent decades as research in biology and medicine becomes increasingly dependent on mathematics and computation.

De Leenheer uses dynamical mathematical models to describe and illuminate biological processes ranging from the cellular to the ecological scale. He has helped develop new modeling approaches for the analysis and design of Marine Protected Areas to enhance fisheries as part of an NSF-funded project. He has also published studies on critical thresholds for extinction in population growth models and has been modeling the effects of climate change on disease severity.

Huge impacts, tiny creatures

The smallest known free-living cells, plankton SAR11, discovered by microbiologist Stephen Giovannoni, are so dominant that their combined weight exceeds that of all the fish in the world’s oceans. En masse, the tiny creatures produce enough sulfur gasses to play an important role in cloud formation and the stabilization of Earth’s atmosphere.

Stephen Giovannoni in from of wooden wall

Stephen Giovannoni, microbiologist

Collaborating with scientists around the world, Giovannoni is now building a database of plankton genomes collected from faraway places, from Massachusetts to Bermuda and the Sargasso Sea, against which future changes in the oceans can be assessed. Understanding the role of plankton is critical to accurately model climate change and its effects.


Read the rest of this series on how scientists at OSU are tackling global warming:

Two women working on iPads in the Learning Innovation Center

Statistician speaks at Women in Data Science event

Women in Data Science event

Associate Professor of Statistics Sarah Emerson gave a presentation at the Corvallis Women in Data Science (WiDs) satellite event on February 3, 2017, which was organized by the Department of Mathematics. Emerson presented her talk on sparse methods for clustering as part of the Applied and Computational Math Seminar. The presentation was a satellite event of the second annual 2017 WiDs Conference at Stanford University.

Sarah Emerson in front of wooden backdrop

Sarah Emerson, Associate Professor of Statistics

WiDs inspires and educates data scientists worldwide, regardless of gender, and supports women in the field. The conference, hosted at Stanford and more than 75 locations worldwide, including Oregon State, focused on the latest data science related research, applications in multiple domains and how leading-edge companies are using data science for success.

Emerson's research focuses on the areas of clinical trial design, biomarker evaluation and statistical genetics applications, as well as methodological and theoretical work in high-dimensional data settings and statistical learning.

Watch the video of Emerson's presentation online.

Javier Rojo in front of columned building

Internationally renowned statistician joins faculty

By Srila Nayak

Javier Rojo, inaugural Korvis Professor of Statistics

Javier Rojo will join the Department of Statistics at Oregon State University as the inaugural Korvis Professor of Statistics in January 2017. He currently serves as chair of the Department of Mathematics and Statistics at the University of Nevada at Reno where he holds the Seneca C. and Mary B. Weeks Endowed Chair in Statistics. As Chair, he provided the leadership and guidance to develop two new PhD proposals – one in Mathematics and one in Statistics and Data Science—that have been approved by the Board of Regents and are due to start during the Spring semester of 2017. He is also an adjunct professor at the MD Anderson Cancer Center in Houston and at the Department of Civil and Environmental Engineering in Rice University.

“I am enthused over my imminent move to Oregon State University and the Statistics Department. The overall quality of the department is very good and the crop of young faculty is outstanding. The future of the department looks bright, and it is an honor and a pleasure to become part of their exciting future,” Rojo said.

Dr. Rojo has made significant research contributions in the areas of survival analysis, nonparametric function estimation, statistical decision theory, random matrices and dimension reduction techniques. He is an elected fellow of the Institute of Mathematical Statistics, the American Statistical Association, the American Association for the Advancement of Science, and the International Statistical Institute.

Prior to moving to Reno, Rojo was professor of statistics at Rice University from 2001 to 2013. He started his academic career at the University of Texas, El Paso, as an assistant professor in 1984 in the mathematical sciences department, where he received tenure and rose to the ranks of full professorship. By the time he left 17 years later in 2001, Rojo had set up and served as the founding director of the National Institutes of Health (NIH) funded Biostatistical Consulting Laboratory at El Paso, which today serves as a premier resource center for the statistical support of research in basic sciences, health sciences and other fields across campus and in the El Paso region.

“I am delighted at the historic nature of Dr. Rojo’s appointment as the first named professorship in the Department of Statistics,” said Sastry G. Pantula, dean of the College of Science.

“As a research statistician and a highly engaged teacher, Dr. Rojo has few equals. His commitment to enhancing diversity through mentoring and providing transformative research experiences to students will help us move toward our strategic goals," added Pantula.

“I am confident that he will advance and enrich the academic environment and student learning immeasurably within the department, in the College and throughout Oregon State University.”

Rojo’s hiring is part of ambitious changes and innovations within the statistics department. This fall, the Department of Statistics launched an online Master of Science and a Graduate Certificate in Data Analytics. The first of their kind in Oregon, the programs will draw upon OSU’s expertise in data science. Rojo is one of several science faculty hired in recent years to advance research in the mathematical, biological, statistical and computational sciences at OSU geared toward building the next generation of leaders in science.

“I am pleased to have Javier join our department. He is an internationally respected statistician who has received numerous honors and awards for his research and service to society. His commitment to enhancing diversity and student success is exemplary in the field of statistics,” said Virginia Lesser, Head of the Department of Statistics.

A highly dedicated teacher and scientific mentor, Rojo has had extraordinary success in recruiting, training and guiding underrepresented minority and economically disadvantaged students toward advanced degrees in mathematics and statistics.

Since 2003, he has been directing the Rice University Summer Institute of Statistics (RUSIS) which started as a Research Experiences for Undergraduate (REU) program at Rice University. It is famous for being the country’s first REU Program in the field of statistics. Rojo transferred the REU program to the University of Nevada at Reno when he moved there two years ago, where it is called RUSIS@UNR. The program has been funded and supported by the National Science Foundation (NSF) and the National Security Agency (NSA) for the last 14 years.

RUSIS@UNR conducts a 10-week intensive summer program for the study of statistics and its applications for a cohort of 12-15 students every year. Under Rojo’s guidance the program has been phenomenally successful: after 10 years the REU program reported that 85% of the undergraduates who attended the Summer Institute were admitted to Ph.D. programs around the country, with roughly 61% of students from underrepresented populations and 53% female.

This was achieved “through intensive statistics courses, close supervision of research projects, and visits to various research institutes and agencies in the area,” according to Rojo, who is responsible for the students’ computational training and research projects.

Owing to Rojo’s sustained efforts and leadership, the American Mathematical Society (AMS) selected RUSIS@UNR for its award “Programs that make a difference” in 2014. The RUSIS program was commended for serving “as a model program for others to emulate,” and praised for “its high level of commitment and successful efforts to improve diversity in the profession of mathematics in the United States.”

Rojo also received the Don Owen Award from the American Statistical Association in 2010. The award is presented to a statistician who embodies the three-fold accomplishments of excellence in research, statistical consultation and service to the statistical community.

Rojo’s commitment toward increasing student diversity and helping low-income, minority and first-generation students excel in mathematics and statistics has deep roots in his personal life. Born to working-class Mexican parents, Rojo—a first generation college student—completed his schooling in Ciudad Juárez. One of five children, Rojo worked "as a painter, a railway worker and a gas station attendant in high school" to help pay for some of his expenses, he writes in a SACNAS (Society for Advancement of Chicanos/Hispanics and Native Americans in Science) biography project.

Having excelled in mathematics at school, Rojo attended the University of Texas, El Paso, where he earned a bachelor’s degree in mathematics. He earned a master’s degree in statistics from Stanford University and a Ph.D. in statistics from the University of California, Berkeley, in 1984.

Rojo has collaborated extensively with statisticians in Mexico, specifically with faculty at the Center for Mathematical Research, and has organized several international conferences in his home country. He was a member of the NSF Division of Mathematical Sciences Committee of Visitors in 2013 where he chaired two subcommittees. He served in the NSF Division of Mathematical Sciences COV in 2016. He was appointed to the scientific advisory committee of the Mathematical Biology Institute at Ohio State University and the Statistical and Applied Mathematical Sciences Institute.

Rojo is the author of more than 75 research articles in top-ranked statistics journals and has edited four books, including the Selected Works of E.L. Lehmann by Springer-Verlag. He served as editor of the Journal of Nonparametric Statistics (2007-2010) and organizes and chairs The Lehmann Symposia in honor of renowned statistician Erich L. Lehmann, who was Rojo’s doctoral advisor at UC Berkeley.

Kanti Mardia presenting in LINC

Welcoming hundreds of statisticians to campus

Kanti Mardia, Department of Statistics, University of Leeds and University of Oxford

The College of Science extends a warm and hearty welcome to the 200 participants of the 2016 International Indian Statistical Association (IISA) Conference August 18-21. The conference kicked off with a lively and convivial wine and cheese reception at the Hilton Garden Inn Thursday evening.

Earlier in the day, graduate students from OSU and other universities participated in four short pre-conference short courses taught by visiting statisticians from Columbia University, Northwestern University, the University of California at Los Angeles and SAS Institute.

With a theme of “Statistical and Data Sciences: A Key to Healthy People, Planet and Prosperity,” the conference offers attendees more than 50 panel discussions on statistical innovation and applications in areas, ranging from big data to genomics, climate science, public health and biomedical science. Featuring talks by many award-winning and distinguished statisticians from varied professions, the conference is a unique, landmark event in the field of statistical sciences in Oregon.

Mousumi Banerjee, Shanthi Sethuraman, John Eltinge, Susmita Datta, Ram Tiwari, Lisa Lupinacci, Sastry Pantula presenting in a panel in the LINC

Sastry G. Pantula, Dean, OSU College of Science (far right); Lisa Lupinacci, VP of Late Development Statistics, Merck; Ram Tiwari – Director, Division of Biostatistics, FDA; Susmita Datta, Professor of Biostatistics, University of Florida; John Eltinge, Associate Commissioner for Survey Methods Research, US Bureau of Labor Statistics; Shanthi Sethuraman, Sr. Director of Global Statistical Science for Diabetes, Eli Lilly; Mousumi Banerjee, Director of Biostatistics, University of Michigan.

Hosted by OSU's Department of Statistics, the IISA Conference has attracted statisticians worldwide, including participants from Japan, China, the United Kingdom, Nigeria and Egypt, across academia, industry, government and research institutes who will discuss the latest statistical developments and challenges in data sciences and related fields.

Read more about the 2016 IISA conference.

Below are highlights from the welcome reception.

arial shot of Chicago skyscrapers at sundown

Statistics researchers well represented at JSM

JSM 2016 hosted in Chicago

Statistics faculty and researchers from the College of Science and across OSU participated at the Joint Statistical Meetings in Chicago this week. Many presented invited talks at JSM 2016, one of the largest statistical events in the world with over 6,000 attendees from 52 countries.

Dean Sastry Pantula spoke on three panels on diversity and mentoring andnhe served as a mentor to several students at the JSM Diversity Workshop and Mentoring Program this year. Dean Pantula is an impassioned advocate for increasing minority representation in statistical education and the sciences, and has been a dedicated mentor to young statisticians for the past 30 years.

Pantula was honored for his outstanding and extensive service to the statistics profession with the 2016 Paul Minton Service Award from the Southern Regional Council On Statistics (SRCOS) at the JSM.

 Jessica Utts, Joe Palca, and Sastry Pantula sitting in audience of JSM presentation

ASA President Jessica Utts; Joe Palca, NPR; and Dean Sastry Pantula, former ASA President.

The following statistics faculty presented talks and posters or chaired sessions:

Sharmodeep Bhattacharyya
Resampling Methods for High-Dimensional Inference (Author)

Yanming Di
New Advances in Clustering Algorithms (Author)

Sarah Emerson
Methods for Next-Generation Sequencing Data (author)
Contributed Poster Presentations: Section for Statistical Programmers and Analysts (author)

Claudio Fuentes
Methods for Next-Generation Sequencing Data (Author)
Semiparametric Methods for Longitudinal and Event Time Data (Author)

Duo Jiang
SPEED: Advances in Statistical Genetics (author)
SPEED: Advances in Statistical Genetics, Part 2B (author)

Yuan Jiang
Statistical Methods in Integrative Genomics (Chair)
Methods and Theory for Integrative Data Analyses (Author)
New Challenges in Complex Data Modeling I (Author)

Virginia Lesser, Chair, Department of Statistics
SPEED: Advances in Survey Research Methodology (author)
SPEED: Advances in Survey Research Methodology, Part 2A (author)

Sastry Pantula, Dean, College of Science
KISS (Korean International Statistical Society) Panel on Leadership Development Workshop
Committee on Minorities panel, “Best practices for recruiting and retaining students and faculty” with roundtable discussion including DuBois Bowman, Louise Ryan, and Bill Velez.
Committee on Minorities panel” “Influential communication: Principles of making a good argument” with Aarti Shah from Eli Lilly.

Lan Xue
Nonparametric Methods for Longitudinal Data (Author)

Miao Yang
Computational Issues in Modeling (Author)

Wanli Zhang
New Advances in Clustering Algorithms (Author)

Jianfei Zheng
Nonparametric Methods for Longitudinal Data (Author)

Kalbi Zongo
Contributed Poster Presentations: Section for Statistical Programmers and Analysts (author)

Other faculty from across OSU participated in the JSM as well.

Ping-Hung Hsieh, College of Business
Contributed Poster Presentations: Section on Statistical Education (author)

Xiaohui Chang, College of Business
High-Frequency and Other Financial Econometric Topics (Chair)
Contributed Poster Presentations: Section on Statistical Education (Author)

Andrew Olstad, College of Business
Contributed Poster Presentations: Section on Statistical Education (author)

students working on their laptops in study room

Online data analytics programs launch this fall

Online data analytics programs

Source: Ecampus

Market demand for professionals with the skills to interpret large quantities of data has never been greater. According to data from the McKinsey Global Institute, the United States could face a shortage of up to 180,000 people with deep analytic skills by 2018 and an estimated 1.5 million managers and analysts.

Data analytic skills are vital for scientific advances and business success worldwide. The Department of Statistics is launching a completely online Master of Science and a Graduate Certificate in Data Analytics this fall.

“Data analytics is playing a major role in drug discovery, climate change, and business and policy decisions. It is an exciting time to be a data scientist in our data-enabled world,” said Sastry G. Pantula, dean of the College of Science.

“These graduate programs are unique in the marketplace. We build global leaders with strong critical-thinking and problem-solving skills who are grounded in the statistical and computational sciences.”

The first cohort is expected to attract a range of students, from experienced analytics professionals to those looking to change careers and become one. The data analytics programs will appeal to students with an aptitude for mathematics and statistics as well as a desire to use data to solve today’s most pressing problems.

Housed in the College of Science, these new programs will expose students to the whole data pipeline, from collecting data, through analysis, to reporting to stakeholders. Students in the 45-credit master’s program will be trained with advanced statistical and predictive modeling skills and strong computational and programming skills to manage and analyze large data sets.

All classes in the master’s program and the 18-credit graduate certificate program were developed and will be taught by faculty from the College of Science and the School of Electrical Engineering and Computer Science at OSU. The programs integrate strengths in statistics, computer science and mathematics. This interdisciplinary approach will train students in many data analysis techniques and, program leaders say, make them appealing to employers in every industry.

“Our faculty recognize that data are often complex, and we know how to deal with messy data,” said Virginia Lesser, professor and chair of the Department of Statistics. “It’s important for students to know that they’ll learn from faculty who have exposure to real data and extensive hands-on experience.

Virginia Lesser in front of shrubbery

Virginia Lesser, head of the Department of Statistics

The need for businesses worldwide to be able to make sense of data is at an all-time high. Data impacts every sector, from finance and travel to health services and neighborhood grocery stores.

“When a store gives you a receipt, it might also give you a coupon for cat litter. It’s tailored to you because it recognizes you just bought cat food,” said Lesser. “That’s data analysis that’s being done immediately to improve peoples’ businesses. It’s everywhere.”

The program is designed to build tomorrow’s leaders who not only know how to extract data but know how to find meaning and actionable insights in the information to guide decision-making.

“We’re in a data explosion. People who can turn data into knowledge are highly sought-after," said Charlotte Wickham, assistant professor in the Department of Statistics.

Offered through OSU’s top-ranked Ecampus, students gain considerable advantages by of learning online with Oregon State. For example:

  • All classes in our data analytics programs are developed and taught by full-time Oregon State faculty.
  • OSU is regionally accredited by the Northwest Commission on Colleges and Universities.
  • Oregon State is a respected leader in the fields of data science and statistics and is well connected with industry.
  • Oregon State Ecampus consistently ranks as one of the nation's best providers of online education.
  • OSU's online learners receive the same diploma and transcript as on-campus students.
  • You can complete your coursework from anywhere in the world via an internet connection.

Apply today

The deadline to apply for fall 2016 is August 21; classes begin September 21. To get started, request more information.

Subscribe to Data, AI and Robotics