Kanti Mardia presenting in LINC

Welcoming hundreds of statisticians to campus

Kanti Mardia, Department of Statistics, University of Leeds and University of Oxford

The College of Science extends a warm and hearty welcome to the 200 participants of the 2016 International Indian Statistical Association (IISA) Conference August 18-21. The conference kicked off with a lively and convivial wine and cheese reception at the Hilton Garden Inn Thursday evening.

Earlier in the day, graduate students from OSU and other universities participated in four short pre-conference short courses taught by visiting statisticians from Columbia University, Northwestern University, the University of California at Los Angeles and SAS Institute.

With a theme of “Statistical and Data Sciences: A Key to Healthy People, Planet and Prosperity,” the conference offers attendees more than 50 panel discussions on statistical innovation and applications in areas, ranging from big data to genomics, climate science, public health and biomedical science. Featuring talks by many award-winning and distinguished statisticians from varied professions, the conference is a unique, landmark event in the field of statistical sciences in Oregon.

Mousumi Banerjee, Shanthi Sethuraman, John Eltinge, Susmita Datta, Ram Tiwari, Lisa Lupinacci, Sastry Pantula presenting in a panel in the LINC

Sastry G. Pantula, Dean, OSU College of Science (far right); Lisa Lupinacci, VP of Late Development Statistics, Merck; Ram Tiwari – Director, Division of Biostatistics, FDA; Susmita Datta, Professor of Biostatistics, University of Florida; John Eltinge, Associate Commissioner for Survey Methods Research, US Bureau of Labor Statistics; Shanthi Sethuraman, Sr. Director of Global Statistical Science for Diabetes, Eli Lilly; Mousumi Banerjee, Director of Biostatistics, University of Michigan.

Hosted by OSU's Department of Statistics, the IISA Conference has attracted statisticians worldwide, including participants from Japan, China, the United Kingdom, Nigeria and Egypt, across academia, industry, government and research institutes who will discuss the latest statistical developments and challenges in data sciences and related fields.

Read more about the 2016 IISA conference.

Below are highlights from the welcome reception.

blue numbers and code loading on translucent screen with black backdrop

International statistics conference comes to campus

2016 International statistics conference

The 2016 International Indian Statistical Association (IISA) Conference "Statistical and Data Sciences: A Key to Healthy People, Planet and Prosperity" will be hosted by the Department of Statistics at Oregon State University in the state-of-the art Learning Innovation Center August 18-21. The conference has attracted 200 statisticians worldwide, including from Japan, China, the United Kingdom, Nigeria and Egypt, across academia, industry, government and research institutes who will discuss the latest statistical developments and challenges.

Sessions at the conference range from statistical innovation and applications in big data, biomedical sciences, network analysis, high dimensional data, genomics, climate sciences, public health and ecology to probability theory and advances in bayesian techniques, biostatistics and spatial statistics. Panels on career development, women is statistics, and collaboration across organizations offer fresh perspective on such topics of interest. The conference also includes a wine and cheese networking reception, banquet dinner featuring Indian food, and an award ceremony.

Debashis Mondal, assistant professor of statistics at OSU, is the organizer and program committee chair of the conference. This past year, several committeesworked collaboratively to plan and execute IISA 2016, including an executive, program, scientific advisory and local organizing committees.

The conference will feature presentations by internationally acclaimed statisticians, such as plenary addresses by Kanti Mardia, an award winning statistician from the University of Leeds and Oxford University, and Xiao-Li Meng, dean of the Graduate School of Arts and Science and statistics professor at Harvard University.

Keynote talks will be delivered by Katherine Ensor,Vice-President of the American Statistical Association and chair of the Department of Statistics, Debashis Ghosh, chair of the Biostatistics Department at University of Colorado, Kannan Natarajan, senior vice president and global head of biometrics and data management at Novartis Pharmaceuticals, and Ajit Tamhane, senior associate dean and professor at Northwestern University.

In addition to the technical talks, the conference will offer sessions on early career development; collaborations across academic, industry and government organizations; and funding opportunities in industry and federal agencies through three panel discussions. Dean Pantula will moderate a panel on career development.

Graduate students from Oregon State and beyond will participate in four pre-conference short courses on applied and statistical software use offered by visiting statisticians from Columbia University, University of California at Los Angeles, Northwestern University and SAS Institute. Students were able to register for the conference and attend the courses at no cost thanks to a grant from the National Science Foundation.

The conference’s focus on data sciences and their role in human health and industry is very timely given the deluge of data in our everyday lives. Everything from health records to environmental monitoring, agriculture and online behavior are being measured and captured in clicks, “likes,” tweets and purchases. With this proliferation of data, the ability to analyze large data sets—big data—has caused incredible demand for people trained in the statistical and data sciences.

“Data science is a key area of growth in the College of Science because it is highly relevant, we have an obligation, we have key strengths and there is tremendous opportunity,” said Sastry G. Pantula, dean of the College of Science at OSU.

“I am thrilled that OSU is the place to convene leading statisticians from across academia, industry and government. We will have some of the brightest minds in the field of data science on our campus. It is an incredible honor and opportunity for our university and our community.”

IISA seeks to promote education, research and application of statistics and probability throughout the world with a special emphasis on the Indian subcontinent.

“The conference will provide platform for statisticians to collaborate across diverse areas of interest, foster partnership across various statistical organizations to move forward the evolving field of statistics and nurture the need of young statisticians” said Amarjot Kaur, IISA President and Executive Director of Biostatistics at Merck.

“Many thanks to the Statistics Department and Oregon State University for providing this beautiful venue for the IISA 2016 conference.”

The conference is sponsored and supported by the National Science Foundation, Merck, TEOCO, Cytel, the American Statistical Association, Elsevier, SAS Institute, International Chinese Statistical Association, Korean International Statistical Society and OSU’s College of Science, Ecampus and International Progams.

3D model of red blood cells

Biohealth science's connection to quantitative sciences

By Srila Nayak

BioHealth

Redefining quantitative and biohealth sciences

Faculty and researchers in the College of Science are interpreting and advancing biohealth sciences in innovative new ways by applying the natural sciences, such as mathematics, statistics and chemistry. In recent times, researches in biology and medicine have been guided by biomolecular analysis technologies, mathematics and computations, and scientists are using these tools to address a spectrum of biological questions about diseases, from how they spread to risk factors.

In the last few years, our College has experienced an impressive spurt of transdisciplinary research in the quantitative and biohealth sciences. Ongoing studies and research advances range from analyzing genetic data on epidemics and inventing disease-detecting biosensors to developing statistical methods to better understand neuron connectivity and the transmission of signals in the brain. Through collaborative research across our campus, our faculty are paving the way for innovative biohealth science research which broadens the training of students across scientific disciplines.

Biological systems and mathematical models

Connections between biology and the mathematical sciences are fueling innovation and expansion in those disciplines. Statistician Sharmodeep Bhattacharyya explains how interpreting data from various experimental sources can generate new insights and solutions in the areas of neuroscience and genomics.

“Statistical methods, with their inherent objective of analyzing the uncertainty of a system help identify key interesting factors in the deluge of interesting data," said Bhattacharyya. "Such jobs can range from identifying a key set of genes affecting a disease for a specific group of people (like in precision medicine) or identifying the interaction between key regions of the brain for people who have a set of genes that causes a neurological disease."

Bhattacharyya has developed new statistical methods to analyze Electro-Cortico Graph (ECoG) array data from human and rat brains to identify connections involving speech and hearing.

Mathematician Vrushali Bokil’s research demonstrates how mathematical modeling, analysis and numerical simulations can illuminate insights in complex biological systems and how the health sciences, in turn, can spark new mathematical ideas. She collaborates with a mix of biologists and mathematicians across the country as well as in the UK, France and Germany on a project funded by NIMBioS (the National Institute of Mathematical and Biological Synthesis).

The project will allow Bokil and her colleagues to generate novel mathematical and statistical methods involving multiple hosts and multiple pathogens and that operate across a range of spatiotemporal scales, and to analyze the effects of climate change and human activities on the emergence of new plant viruses. Bokil points to the increasing use of mathematics to model complicated biological systems.

“It is exciting to be at the interface of biology and math,” said Bokil. “I write down a system of equations that models the physical or biological system. While the mathematical modeling and numerical simulations are fascinating in and of themselves, the added value of feeding back into biological applications is very rewarding.”

Benjamin Dalziel, an assistant professor in Integrative Biology, is part of a growing breed of biologists who are turning the biological sciences into a more quantitative field. Dalziel is a population biologist who uses mathematical tools to answer questions about the spread of infectious diseases, such as influenza and measles in populations and cities.

Dalziel, who also has an appointment in the mathematics department, maps hotspots of pathogen activity and diversification, and develops mathematical models to explain the patterns he finds. A current project explores whether there are systematic differences among cities with respect to their epidemic risk.

“I find the connections between mathematical modeling and biology very interesting. After developing a model, we ask, 'Is this happening in nature and how do we test it?' And if nature is doing something different, 'What did we get wrong with the model?' Sometimes there is a lot you have to do with the model besides [reviewing the] data to understand its behavior and to get it to interface with the real world," said Dalziel, who is developing a new mathematics course specifically for the life sciences.

Innovative disease imaging

A major application of analytical chemistry and its quantitative aspects to biology involves the creation of tools that directly aid in the diagnosis of cancer, heart disease, strokes and other serious ailments.

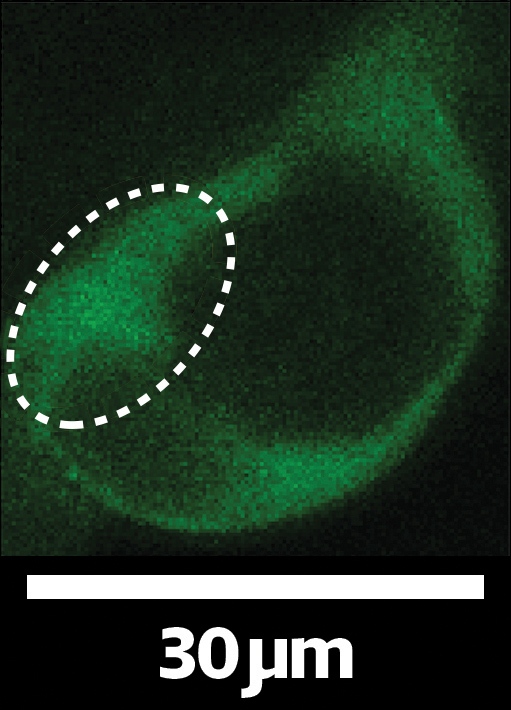
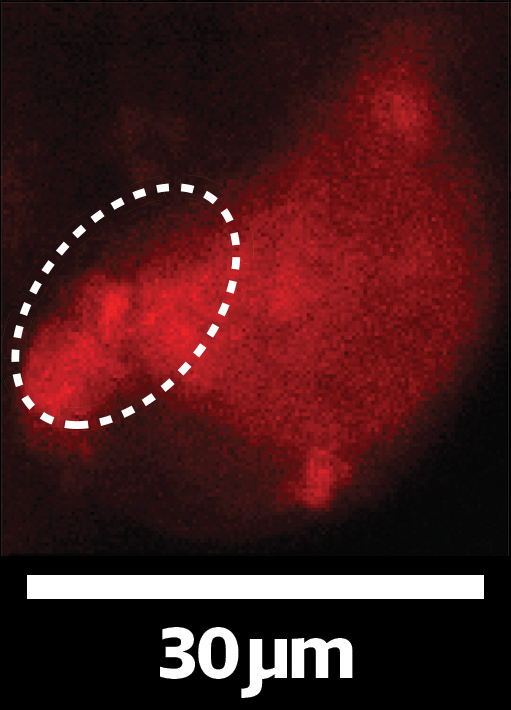
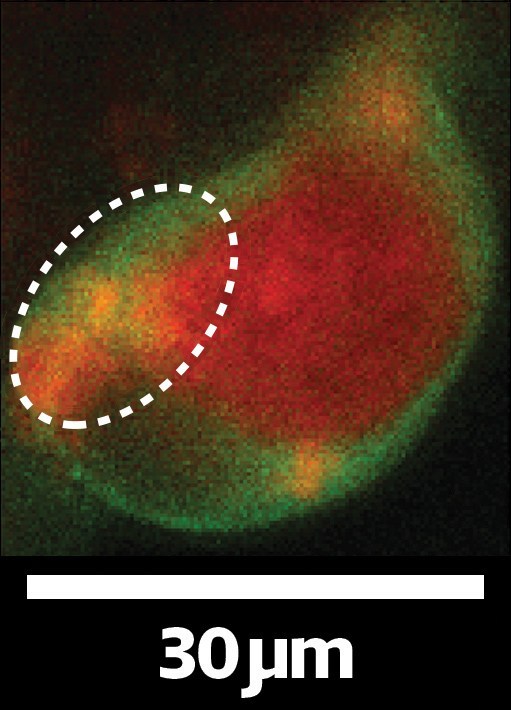
Chemistry assistant professor Sean M. Burrows runs a busy lab comprising undergraduates and doctoral students and their research is focused on innovating technologies to visualize biomarkers of disease. They pioneer novel, colorful fluorescent biosensor designs—analytical devices that relate biological molecules to a fluorescent signal—for visualizing and quantifying microRNAs, which are small non-coding RNA molecules that have a role in a plethora of gene regulatory events.

MicroRNAs hold great potential to yield information about the beginning stages of a disease and cell/tissue activity. Burrows and his team are trying to develop highly efficient fluorescent technologies for basic research and clinical use.

“Basically the idea is to design an imaging technology that will give us more information on the molecular interactions within the cell,” explains Borrows. “[For example], can we create an instrument that greatly advances the information content in terms of the numbers of colors we can look at in a cell? With the current technology, you could see one or two colors from the cell. But if we can look at 10 or more different colors, that will tell us much more about a biological mechanism," adds Burrows.

In an exciting breakthrough, the Burrows group designed a more efficient fluorescent biosensor for better signal interpretation from microRNA biosensors. The innovation has attracted significant attention in the field and was favorably reviewed in an article on the field of emerging microRNA biosensors in Analytical Chemistry.

However, existing imaging technology to learn about the underlying details of cellular mechanisms, such as the super resolution microscopy, is expensive. Burrows is keen to develop a cheaper alternative that can be used in a regular microscope.

“We can then open the door for more researchers to get more information from the cells they are interested in studying. This, in turn, will enable more transformative breakthroughs to understand disease progression and ultimately find cures.”

This figure shows that the biosensors can enter a cell’s cytoplasm and nucleus to find where microRNA expression occurs within the cell. Green shows the cytoplasm and the dark green spot is the nucleus. Red indicates the biosensor. The circle and the red nucleus indicate where the biosensor has entered the cytoplasm and nucleus, respectively.

Susan Dunham sitting in cubicle

Market demands graduates with data analysis skills

By Srila Nayak

Susan Dunham, the first Oregon State mathematics graduate with the statistics option.

The employment surge for statisticians along with Oregon’s drive to increase the number of students pursuing degrees in STEM fields has led the Department of Mathematics at Oregon State University to offer a new undergraduate degree option in mathematics allowing an emphasis in statistics. Developed in close collaboration with the Department of Statistic, this new concentration prepares students for the current marketplace where statisticians have a professional edge, according to recent surveys and studies.

Mashable, an online news site that covers digital culture and technology, labels statistical analysis and data science as 2015’s “hottest profession.” In the last five years, such enthusiastic epithets have been increasingly applied to the field of Statistics, once viewed as an esoteric and unexciting discipline.

Amstat News—the magazine of the American Statistical Association—cites data that tracks this revolutionary shift in attitude toward statistics and statisticians. Amstat’s comprehensive mathematical sciences survey reveals a 78% increase in undergraduate statistics degrees from 2003 to 2011 and a 40% increase from 2009 to 2011.

Suddenly, it seems, everyone from Google and Netflix to Walmart, Gap and the federal government are hiring people with statistical skills and expertise.

Susan Dunham, the first mathematics graduate with the statistics option at OSU, found that her training made her a frontrunner in the job market. She was hired by a top insurance and finance company, before even completing her degree in December 2014 with a BS in Mathematics, a statistics option, and a minor in actuarial science.

Dunham, who has always enjoyed data analysis, honed her talent in the area through the seven statistics courses she took during her undergraduate career, five of which have counted towards her statistics option. She recently started working as an actuarial analyst trainee at State Farm’s auto pricing unit in its corporate headquarters in Bloomington, Illinois.

Dunham said her statistical skills and knowledge helped her land an internship with State Farm’s research unit last summer. When she impressed her managers with her abilities in data analysis, it helped pave the way for a full- time job offer.

“The statistics courses I was able to take at OSU definitely have an impact on my career."

"My managers are very excited about my coming into the company with this knowledge. One of my managers I spoke with today was actually really excited to hear that I had some experience with R—the data analysis software—(thanks to ST 411 and 412) and wants me to use it in my job for certain tasks,” Dunham wrote in an email. “The courses in the statistics option helped give me a good base knowledge for some of the actuarial exams I will be taking in the next few years as well.”

Statistics 411 and 412 are called Methods of Data Analysis and give students training in statistical applications.

Besides the promising job potential of a degree in statistics, the discipline itself has achieved impressive gender parity. According to a recent article in The Washington Post, statistics is ahead of all other STEM fields in “attracting, retaining and training women.” More than 40 percent of the degrees in statistics go to women, and they make up 40 percent of tenure-line faculty in departments. In the Department of Statistics at OSU, 50 % of tenured or tenure-line faculty are women.

OSU’s Department of Statistics is the only one of its kind among public universities in Oregon. It does not itself currently offer a undergraduate degree, so the new statistics option in mathematics offers a unique opportunity for students.

“The new Statistics option for mathematics students gives an avenue for undergraduates to develop an expertise in statistical applications together with an understanding of the mathematical theory underlying statistics,” says Mina Ossiander, professor of Mathematics and undergraduate advisor for the Statistics option.

Dunham, who says that she would have majored in Statistics if OSU had offered it, had already taken many statistics courses in high school when she started as a math major in 2011.

Although Dunham began with a minor in Statistics, she found herself wanting more challenging, upper-level statistics courses.

“The minor in Statistics required a lot of basic statistics courses that I had gained experience with in high school, or skipped and gone straight to the upper division classes,” says Dunham.

Dunham jumped at the chance when Ossiander, who had taught Dunham and was well aware of her career goals and preferences, told her about the newly developed Statistics option.

“I preferred statistics more than the pure mathematics focus of the major. I told Mina I'd sign up as soon as possible!” says Dunham. “So in short, I chose the stats option because it let me take more statistics courses, which was where I wanted to focus.”

With this new degree program, OSU joins other high-impact public universities such as UC Berkeley, University of Washington and University of Utah that offer similar degrees in the mathematical and statistical sciences.

The Statistics option has succeeded in attracting attention from mathematics majors. Currently, there are about a dozen Math majors who are enrolled in the Statistics concentration. Ossiander predicts that there will be 5-10 Statistics Option graduates annually.

John Sall standing in front of painted, blurry backdrop

From Big Data to Big Statistics

By Debbie Farris

John Sall, co-founder and Executive Vice President of SAS Institute, Inc.

Now that we have Big Data, we face new challenges. Depending on your view, it’s either an incredible opportunity for all of us or a large, looming crisis. The College of Science held its Distinguished Lecture October 31. John Sall, co-founder and Executive Vice President of SAS Institute, Inc., discussed how to effectively analyze Big Data in order to find meaning and significance in the plethora of information.

Sall was also one of the developers of JMP statistical software that has dynamically linked statistical analysis with the graphical capabilities of Macintosh computers since 1989. Now running on Windows and Macintosh, JMP continues to play an important role in modeling processes across industries as a desktop data visualization tool, a business solutions tool, and an academic research tool. The limitless opportunities of Big Data to enhance and accelerate innovation in research, technology, business, science and education requires a methodical approach and a streamlined work flow. With many meanings of Big Data being bandied about, Sall puts it this way. “From a wide view of Big Data, there are simply too many things to look at. But screening for just the big effects can cause selection bias. When graphing probability values, all the good ones bunch together near zero. With tall data, everything is significant, but many effects are too small to care about. With holes and bumps all over data, something automated is needed to adapt to them.” To find out why Big Data should matter to you and how to resolve all of this, come hear Sall shared his insights about Big Statistics analytic work flow and how people can use it to make decisions. “Statistical analysis and data science are a key to discoveries and innovation,” says Sastry Pantula, Dean of College of Science.

“Extracting useful knowledge from Big Data in a timely fashion is not only useful for businesses and the government, but also useful for drug discovery and healthcare (healthy people), climate modeling and sustainability (healthy planet) and for security and economic development (healthy economy).”

Data analysis yields insights into a wide range of subjects from the environment, marine studies and human health to the humanities and business. People who can apply value and meaning to real-time data are in increasingly high demand. In fact, a recent study predicted a work-force gap of 1.5 million managers and analysts with the skills to decipher and translate data patterns for decision-making (McKinsey & Company).

Who knew data analysis could be fun? Recently the Harvard Business Review called data science the sexiest job of the 21st century. Statistical, mathematical and computational sciences graduates would seem very qualified to fill that role and those well-paying jobs, leading to a rewarding career. To meet this explosive demand in the market, the College of Science is developing a master of science in data analytics and planning to launch in the fall of 2015.

As we grapple with Big Data today, it’s helpful to look back through history for context. The 1970s were characterized by a spirit of discovery in science and technology. Sall established SAS with several partners in 1976. He designed, developed and documented many of the earliest analytical procedures for Base SAS® software and was the initial author of SAS/ETS® software and SAS/IML®.

Then in the late 1980s, researchers and engineers needed an easy-to-use and affordable stats program. So SAS launched a new software product, JMP to dynamically link statistical analysis with the graphical capabilities. Sall remains the lead architect for JMP.

In 1998, Sall was elected a Fellow of the American Statistical Association in 1998 and has held several positions in the association's Statistical Computing section. He serves on the board of The Nature Conservancy, reflecting his strong interest in international conservation and environmental issues. He also is a member of the North Carolina State University (NCSU) Board of Trustees.

Watch the video of John Sall's presentation.

Subscribe to Economic Impact